

Late To The Party

“Looking back down the road from a little ways out, I never had a fear and I never had a doubt. If I had a lick of sense, I’d have figured that out pretty fast.”
-James McMurtry “If it Don’t Bleed”
I thought of the above line from McMurtry when I was reading some snippets on Cocoa’s current rally. We touched $10,000 a ton in London trading this morning and a lot of pundits declared this might be the time to go short, because, well you know - the law of large numbers.
I mean, look, I am not suggesting that 10k in Cocoa does not lead to a trading top, what I am saying is that the “large number attraction” has lost some of its glory since the days of the Market Wizards books, where Monroe Trout exposed the concept to the public.
From a fundamental perspective, it is worth, like anything, understanding just who plays in this game.
This will be the 3rd consecutive year of a production shortfall (-500k of metric tons).
75% of the production is essentially in the Ivory Coast of West Africa and is, similar to Coffee production, in the 3rd world.
5 trading houses control 55% of the activity with Olam and ADM are probably the only 2 houses anyone has heard of without deep ties into the space.
Stocks/Use Ratio is running around 21%. Lowest since 1978.
In 1978 terms, the active contract would need to press $45,000 a ton to equal that move in inflation adjusted pricing from 45 years ago.
It’s not all bad…Dec ‘24 contracts are at $7,400 and the curve is reflecting better production into ‘25 and beyond.
The craziest part of this is the illiquidity in the marketplace. Open Interest is roughly -35% lower than 6 months ago across the Cocoa Trading Cycle in the futures market.
So, look, anytime a tradeable market moves into an orbit like this or like SMCI in equities, it is worth asking the question, should I trade it? I mean the lure is undeniable and this morning a pretty smart macro guy that I follow on X went out and announced that he shorted a 1 lot. I mean sure, have at it. But I would also suggest that the odds of hitting a parlay in the NBA tonight might be higher than the success rate of the trading tourists that are beginning to enter the Cocoa market.
Keep an eye on it. And keep your powder dry.
Speaking of Technical…
I’ve been doing a bunch around the gamma trades and levered ETF. I came across this snippet from Ed Yardeni yesterday:
The Federal Reserve is making it difficult for investors to be anything but bullish on US equities.
This may be perfectly fine in the near term but creates a risk of longer-term bubbles that typically don't end well. This was the implication last week when several guests drew comparisons with the mid-2000s. Today the sentiment was echoed by Ed Yardeni of Yardeni Research, who said he was reminded of when traders sowed the seeds of the dot-com bubble.
“This is starting to possibly be reminiscent of the 1990s, and if you ask me where we are in the 1990s, I think we’re at Dec. 5, 1996, where Alan Greenspan asked how do we know if it’s irrational exuberance,” Yardeni said. “And I’m concerned that the market would go up too fast. It’s great on the way up. Melt-ups are wonderful but by definition they can lead to melt downs.”
I suppose that is one way of hedging. Even the most ardent bulls (Yardeni and Lee) expected the markets to pause in Q1 and soak up the monster 2-month rally that ended ‘23.
And now that the expectation of consolidation has not occurred, well then, my friend, I must tell you that we might be going up too fast.
Ok. I guess. Should we go up slower? Would that make it better? Or is this more of an explanation around the market not acting in the way that one predicted? I don’t know, but I find it kind of comical.
However, that bit of comedy led me to think about end of day gamma and levered ETF orders. And man, let me tell you, that is one helluva rabbit hole.
If you ever want to watch a couple of hours disappear, hop onto the SSRN (Social Science Research Network) and start reading through some of the topics around gamma hedging and levered ETF order distribution.
Anyway, after my eyes crossed, I decided to focus on one paper in particular from the Swiss Finance Institute titled “Liquidity Provision To Levered ETF’s and Equity Options Rebalancing Flows: Evidence From End of Day Stock Prices.” And then, as the Felice Brothers stated in a great song, “I put some whiskey into my whiskey” and set out to work.
A growing literature focuses on cross-sectional intraday return variation, linking it to investor heterogeneity on the stock level. In this paper, we provide novel insights into how derivative markets add to cross-sectional variation towards the end of the trading day.
By drawing upon a unique dataset merging data from several exchanges identifying types of market participants in U.S. stock options and the portfolio composition of U.S. equity focused leveraged ETFs, we document large price pressure on end-of-day returns when option market makers engage in delta-hedging and leveraged ETF swap counterparties rebalance their positional exposure.
We show that delta-hedging and leveraged ETF rebalancing exert an economically large price pressure on end-of-day returns. Whereas leveraged ETFs contribute to a basket-wide momentum effect, delta-hedging can either have a stabilizing effect in the 5 forms of end-of-day reversal but may also exaggerate intraday momentum.
The direction is determined by the previous return of the underlying and the aggregate option inventory of market makers. Moreover, our results reveal that option market makers have discretion on the execution of their hedging strategies, especially after intraday jumps.
On the contrary, leveraged ETF swap counterparties are required to establish the target exposure of the fund at the close. This institutional flexibility translates into information asymmetry faced by liquidity providers, constituting a friction for liquidity provision.
Consistent with the assumption that the impact of rebalancing is mechanical in nature, we also document that it is transitory, as the effects fully reverse during the next trading day.
Such a reversal materializes in a shorter time frame for leveraged ETFs price pressure than for that induced by gamma imbalances.
We finally show that the effect of option market imbalances is persistent over the years, while that of leveraged ETFs is significantly decreasing, further suggesting a key role of information asymmetry as the main friction underlying their dynamics.
The chart below (ending in 2020 when the study was concluded) shows the demand imbalance for levered ETF’s and Gamma needs from dealers. If we agree that the marketplace for these concepts has grown significantly (as shown in my past few posts) since the end of this study, well then we are clearly in a world of levered ETF and Gamma pricing pressures.
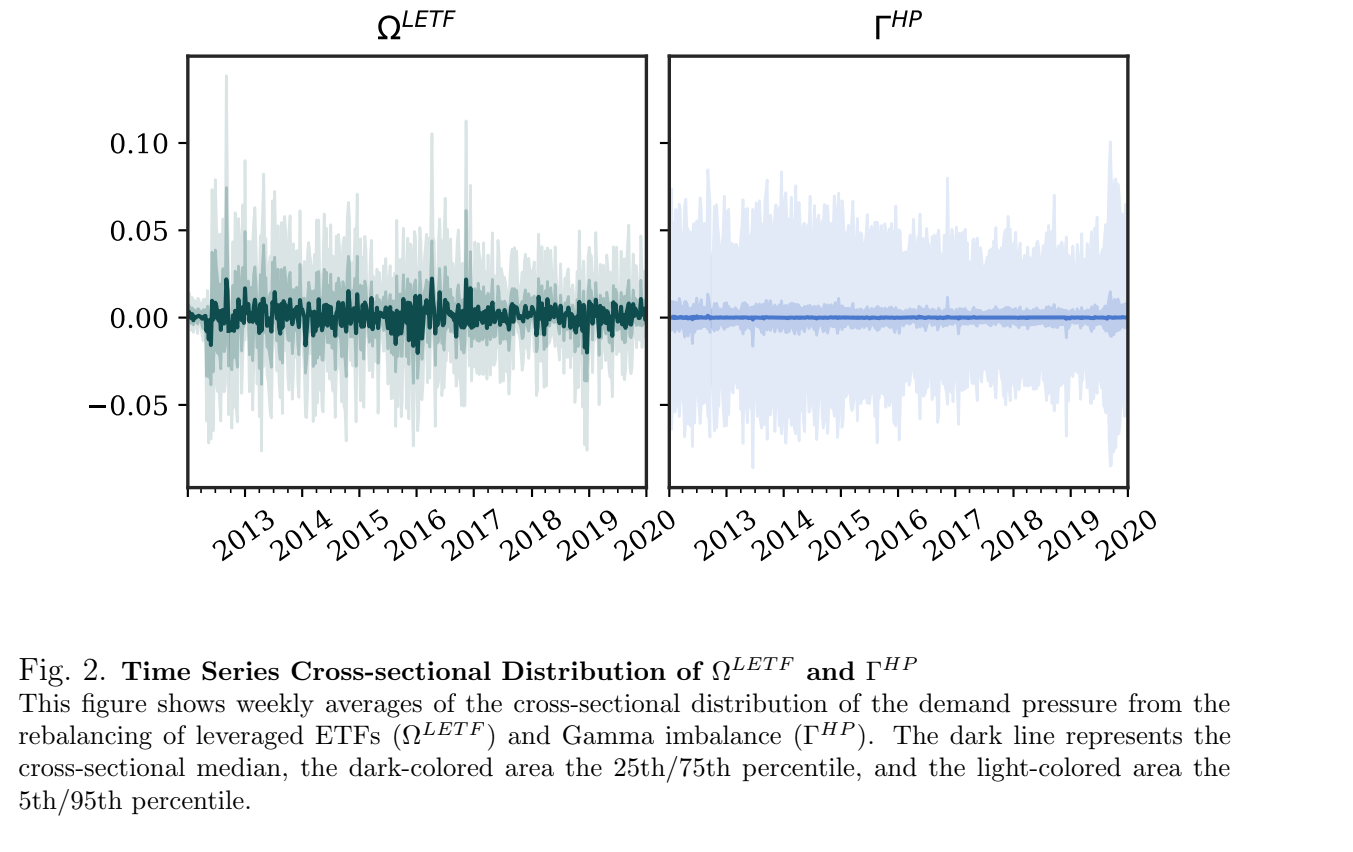
RESULT
Sure, some of this is known. We all know that markets move and settle and interact with specific mandates from some of the key players in the dynamic. But that of course leads to what the above study shows. It shows that, each day, these products will artificially settle pricing at a level and that level will be unwound the next day. So, I suppose that ultimately, we are witnessing a game in which the market participants front run the event (similar to SMCI into the SP 500) and after the event has closed, the pricing will unwind.
The value of this is to add it into your toolbox. I mean, it is pretty easy sometimes to wonder why I didn’t hold a trade longer or why I didn’t hit a bid earlier. And then watching, in dismay, as the pattern unfolds, and your new Escalade turns into a Prius right before your very eyes.
I don’t know. But for me, I like to know the rules and the players in the game.
FORTUNE FAVORS THE BOLD…?
Below is a chart of the MSCI World Index (ex-USA) on a monthly read back to 1995. Pretty easy to look at this and determine that we are at a key level.
And so, I don’t know, but for me I think that when I look at a “World Index” it would have global indices (sans the US) structured in a pretty even distribution. But alas, upon reading the instructions, it’s an index comprised of a bunch of stocks not domiciled in the US. The largest 4 holdings are:
TSM, NOVO, ASML and NESN.
So, that covers Semiconductors, Weight Loss and Chocolate. I mean, you can’t get any hotter than that can you?

CORRELATE THIS
RUSSELL 2K AND NASDAQ 100
So, I was working on a theory that started out innocent enough, I was wondering why it seems like whenever the Q’s rally the IWM loses ground. And vice versa. Now, obviously that is not always the case, but it seems to me that there are some strange things happening in terms of correlation between these two products.
And that led me to some database diving.
Here are the results.
Chart 1: Historical look at the Correlation between the two indices. Each year is independent, meaning it begins on the first trading day of that year and ends on the last. There is no cumulative look in this chart.

NEXT STEP
So, that graph above shows correlation levels that ranged from HIGH (2018 and 2022) to LOW (2017). But nothing that, at least from a historical perspective, could give one an edge of sorts.
But then I wasn’t really thinking about this type of scenario back in 2018 or 2015 or 2022. Rather, this has been a relatively new construct in the correlation breakdown between the two products.
That leads to the event. The event was the 10/27/23 close and bottom of the 22/23 bear market.
So, I decided to run it from there and here are the results:

RESULTS
The graph above is a 21 Day Rolling Correlation starting on Jan 2, 2023 (Blue)
The Orange is a 10 Day Independent Correlation Reading starting on 10/30/23.
Note that 1/3 of the orange readings register between 0.3 and 0.11 - I mean, you get down to 0.11 and there is, essentially, very little correlative fact between the two products.
Further, the fact that the 21 Day Correlation is registering .60 suggests that this diversion will not end anytime soon.
From a trading perspective, it is worth considering a spread trade between the two products. As their correlation continues to erode, this will lead to sharper movements in the spread.
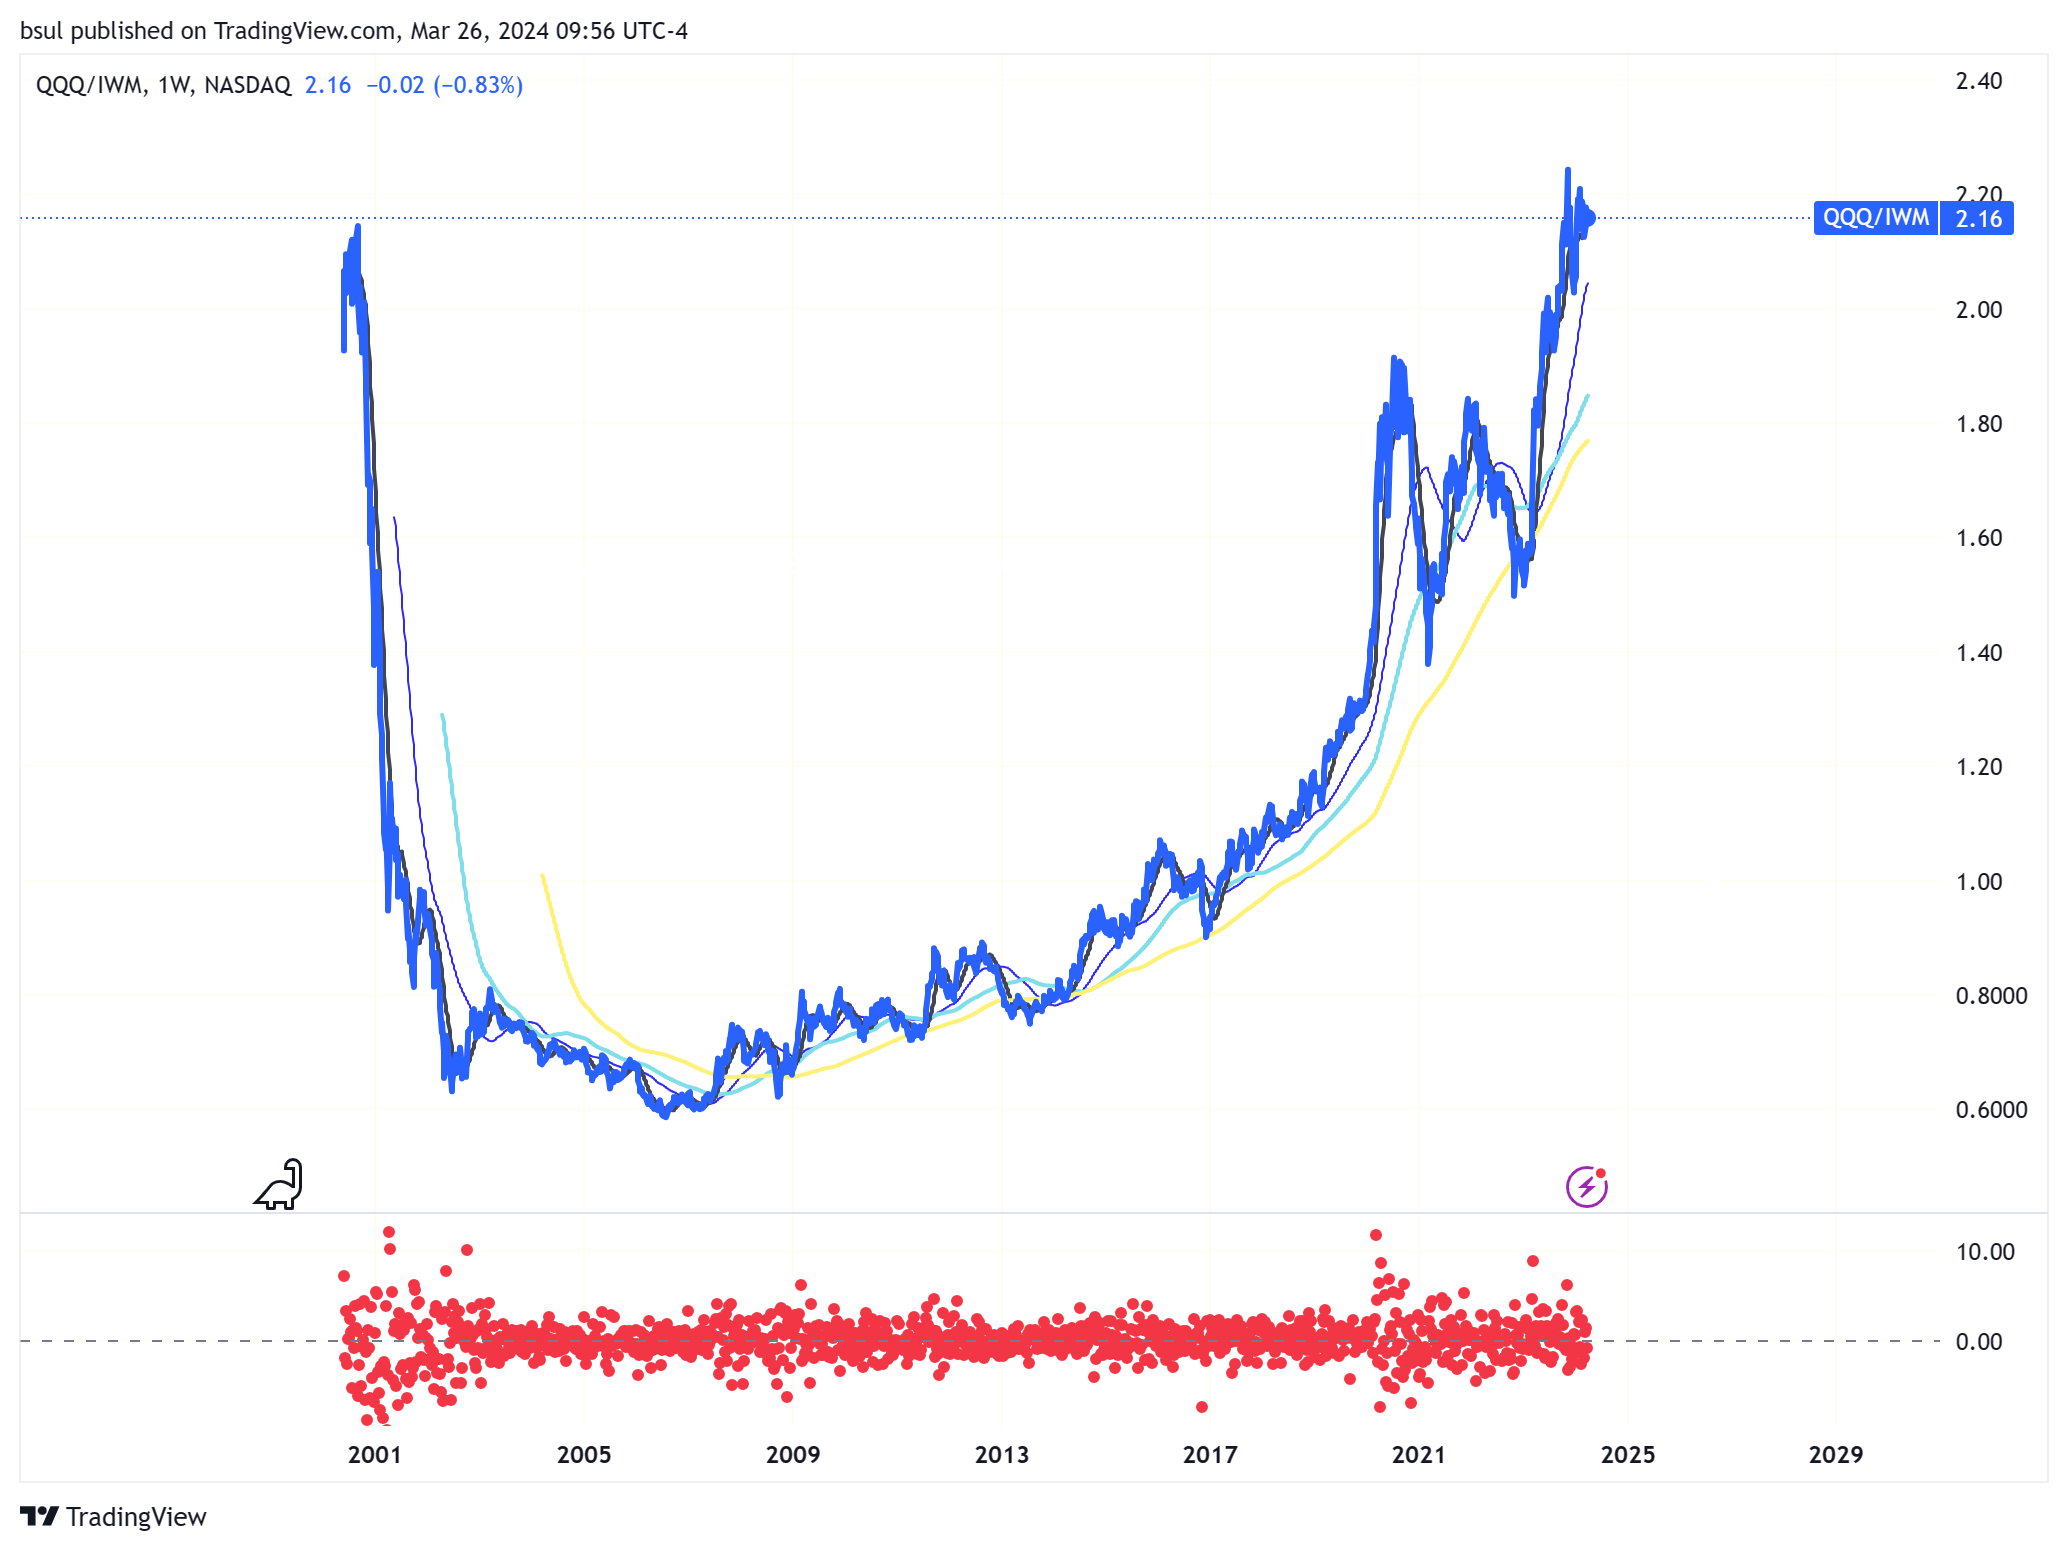
And that of course leads to the Weekly graph below of the Ratio Spread in QQQ/IWM going back to the start of the century.
Note the weekly net % changes highlighted in the Red Circles on the bottom pane.
Something is gonna happen here, not sure when and not even sure of the direction (could be more Q’s outperformance) but get ready.
Essentially, the correlation change (lack of correlation) is a coincident indicator to the result below (QQQ outperformance vs IWM).
Keep An Eye On It.
DAILY NOTES
DJT begins trading today and is up over $70, I think that makes Trump’s holdings worth over $5b. Not bad. Not bad at all.
REDDIT continues to rip since its IPO. Up another 15% this morning.
MOVE index continues to decline, now printing 90. Highlighted last week.
My largest grain position remains Short the July-Dec ‘24 KC Hard Red Wheat. It is printing a big area at -30c. Keep an eye on it.
Stopped out on my last 20% in the SMCI short during yesterday’s rip rally in the stock. The stock is acting very similar to TSLA post its inclusion into the SP 500. Dropped -20% the two days post inclusion then rallied sharply back. If the TSLA comparison holds (and I am not suggesting it will) it would lead to a continued bid in SMCI through old highs.
ASX 200 back challenging its ATH. Nikkei just under its recent highs as well.
Trade Em Well Today