

Anodyne

Anodyne, when used as a noun, is a painkilling drug or medicine. It is also a great tune from Uncle Tupelo back in the 90’s.
I actually played some Tupelo and thought about NVDA and the markets and the Fed and liquidity and inflation and well, just about everything under the Macro sun last night and this morning.
And what I came away with is that the FED seems to be in a habit of washing away pain. This has occurred several times since the 9-11 attacks. Bad things happen, cut rates. Ok. So, that playbook makes sense, but now we are on tilt. Right? I mean, the FED PUT is alive and well and Powell seems itching to cut rates and yea, prices are up but that doesn’t hurt me…it only hurts the other guy. And I further suppose that the creation of liquidity and the inflation it caused post Covid has not, as of yet, had its reckoning across the globe.
But in the meantime, as we wait for Godot, a new savior has emerged. And he wears a leather jacket. Everywhere. No matter what the weather.
And this guy and his stock have the chance to make me continue to feel good.
He is in fact, the markets anodyne to continue in this state of All-Time Highs and basic euphoria around our collective 401k’s.
As you will read below, NVDA has now become a Macro event. Just like a FED meeting, CNBC has its countdown clock working and every analyst, even the B listers are on somebody’s speed dial today.
SOFT LANDING, NO LANDING, RECESSION ODDS
Slow trading weeks make the analysts come out in force to make sure their trading desks still get some of that sell-side commission money. I was thumbing through a report last night and came across this:
The past week’s US CPI print raised hopes that US inflation is slowing in the current quarter following an unexpected acceleration in the first quarter. We are skeptical of such hopes given the persistency of core services and rent inflation.
At the same time we recognize that the optimistic scenario of slower inflation and soft landing has a decent chance of playing out in particular if the US economy weakens towards trend or modestly below trend.
We attach around 50% probability to this soft landing scenario. This means that there is 50% probability of the macro picture deviating from the soft landing thesis either because there is a break in the US economy or because persistent inflation induces the Fed to keep rates high for a prolonged time period or to raise them further, thus raising fears of an eventual hard landing in 2025/2026. In other words, deviations from the soft landing scenario entail some form of US recession at some point over the next one to two years.
And with risk markets pricing in very little probability of deviation from soft landing, we believe that a defensive stance is justified. One way of seeing this is by looking at the probability of US recession embedded in asset prices. Our approach has been to compare the current cycle peak to trough declines of equity indices to those seen during previous recessions.
Given the higher cyclicality and interest rate sensitivity of small caps due to their greater reliance on floating rate debt, that makes them a more suitable place to gauge cyclical risks, in our view. The average peak to trough decline for US small caps has been around 33%, over the previous twelve US recessions, only modestly worse than the 29% seen for the S&P 500.
Since its January 2022 peak the Russell 2000 small cap index has declined by 8%, mechanically implying 8%/32%=25% probability of US recession. In other words, our simple framework implies that smallcaps price in rather modest probability of US recession. And most of other asset classes, including the S&P 500, price in even lower probability of recession than US small caps.
Beneath the surface, there are three interesting trends, one being maintained, and two showing a rotation:
• 1. All the US earnings growth is still Mag-7 driven. Q1 was the 5th quarter in a row where, if Mag-7 contribution is taken out, the remaining 493 S&P500 constituents have shown outright negative yoy% EPS growth.
• 2. Europe is starting to do better vs the US, relative to historical trends. Over the past quarters, US earnings strongly beat Eurozone, and at an accelerating pace. This is changing, with Q1 US earnings spread vs Europe beginning to narrow. Looking at median Q1 EPS growth rates, Europe improves from -7% to 0% yoy. The shift is consistent with relative bottoming in Euro Area PMI momentum vs the US, and was one of the reasons why we upgraded Eurozone vs the US last quarter. We continue to believe that the region will at least hold its own vs the US, irrespective of the direction of the overall equity market.
• 3. Cyclical sector earnings are softening vs Defensives. For S&P500, median Cyclical EPS growth is now below Defensives, for the first time since COVID. For SXXP, it is at -15%. This follows a phase of poor earnings delivery of Defensives, and is one of the reasons why we argued in early April for a rotation into Defensives, especially into the Utilities and Real Estate sectors.
THOUGHTS
LANDING: I am not sure how anyone can accurately predict a 50% probability of a soft-landing with keeping a straight face. So, let’s just toss that out and agree that this is crappy analysis.
Small Caps: I give a little more leeway to the small-cap concept and the baseline of recession odds. Still don’t find it actionable.
Beneath the Surface: Better research here. I still don’t really buy the entire 7 vs 493 theory as we could absolutely show EPS growth in the top 50 names, cumulatively, in the SPX. The real laggards have been in the bottom 40% of the weighting in the index. That is where growth has stopped and further underscores the Bigger Getting Bigger mantra that we continue to see in the equity markets.
To put it in perspective:
If you take the top 50 SPX names and equal weight them, the 10 stocks down this year equate (roughly) to the gain in NVDA. So, what it is telling us is simple: the larger market caps are growing in price and earnings projections and our equity markets have become bifurcated. And to take it a step further, I suppose this is why NVDA has turned into a Macro Event.
Crazy times.
NVDA
What is truly remarkable about Nvidia is the way its reported earnings, revenue and margins have grown since the launch of ChatGPT.
I mean, I’ve never seen anything like it. It’s mind-blowing. Think about these facts:
UBS equity strategist Jonathan Golub says that Nvidia represents 5.2% of the S&P 500’s market cap.
Its earnings per share are expected to expand by 411% compared to a year ago, contributing 2.5 percentage points to the market’s 10.3% growth.
And of late, it’s done a great job of staying well ahead of lofty expectations. Golub says that it’s beaten consensus forecasts by an average of 20% over the four quarters of 2023: by 11.8% in the fourth, 19.1% in the third, 28.8% in the second, and 18.4% in the first, announced exactly a year ago.
Correlation doesn’t prove causation, but it’s fascinating that the S&P 500’s price/earnings ratio has risen more or less perfectly in line with changes in Nvidia’s share price in the 12 months since Nvidia Day:
From Bloomberg:
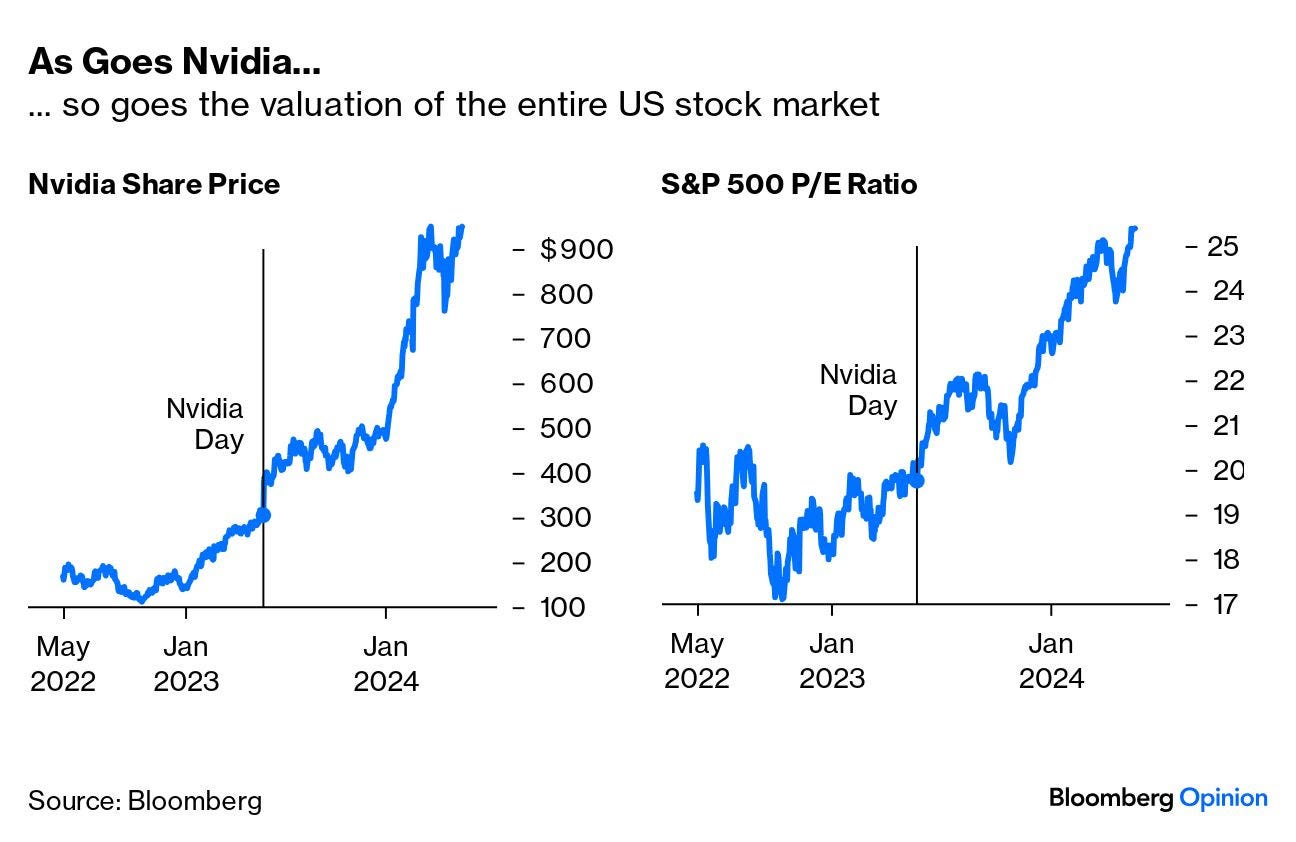
I think we can all agree that this is not good in terms of overall health for the rest of the marketplace of stocks. I suppose if we believe that AI will displace some jobs and some companies then the revenues for Nvidia are someone else’s capital expenditure that will generally depress earnings in the first instance. At least to an extent, its gains are at others’ expense.
So, according to John Authers (and I agree with this point) you cannot look at NVDA as a bellwether for economic growth. Yet, the results of NVDA are being treated as a Macro Event.
I mean, it seems non-sensical to me. And ultimately, there will be a trade in here somewhere. It could be betting that NVDA continues to grow and amass an even larger seat at the table, becoming the world’s most valuable company. If that were one’s wager, a simple Ratio Trade of long NVDA/Short the Equal Weight SPX or QQQ would work. One could go further and traffic in long NVDA/Short IWM or MDY as neither index have NVDA as a holding.
Of course, the opposite could happen and NVDA could stumble. But if one is to put their faith in the idea that NVDA is not a Macro Beacon and that it will hurt other companies as it advances…well then, it is awfully hard not to be long the stock against a basket of other components.
Keep an eye on it.
MORE TO THE STORY
Longtime readers know that I mark most of my studies and lookbacks at two points in the past 18 months.
The first is the liquidity the Fed provided during the Regional Bank Crisis. This coincided (basically) with Chat GPT and the LLM explosion.
The second is the October 30 low and the subsequent Pivot by Powell.
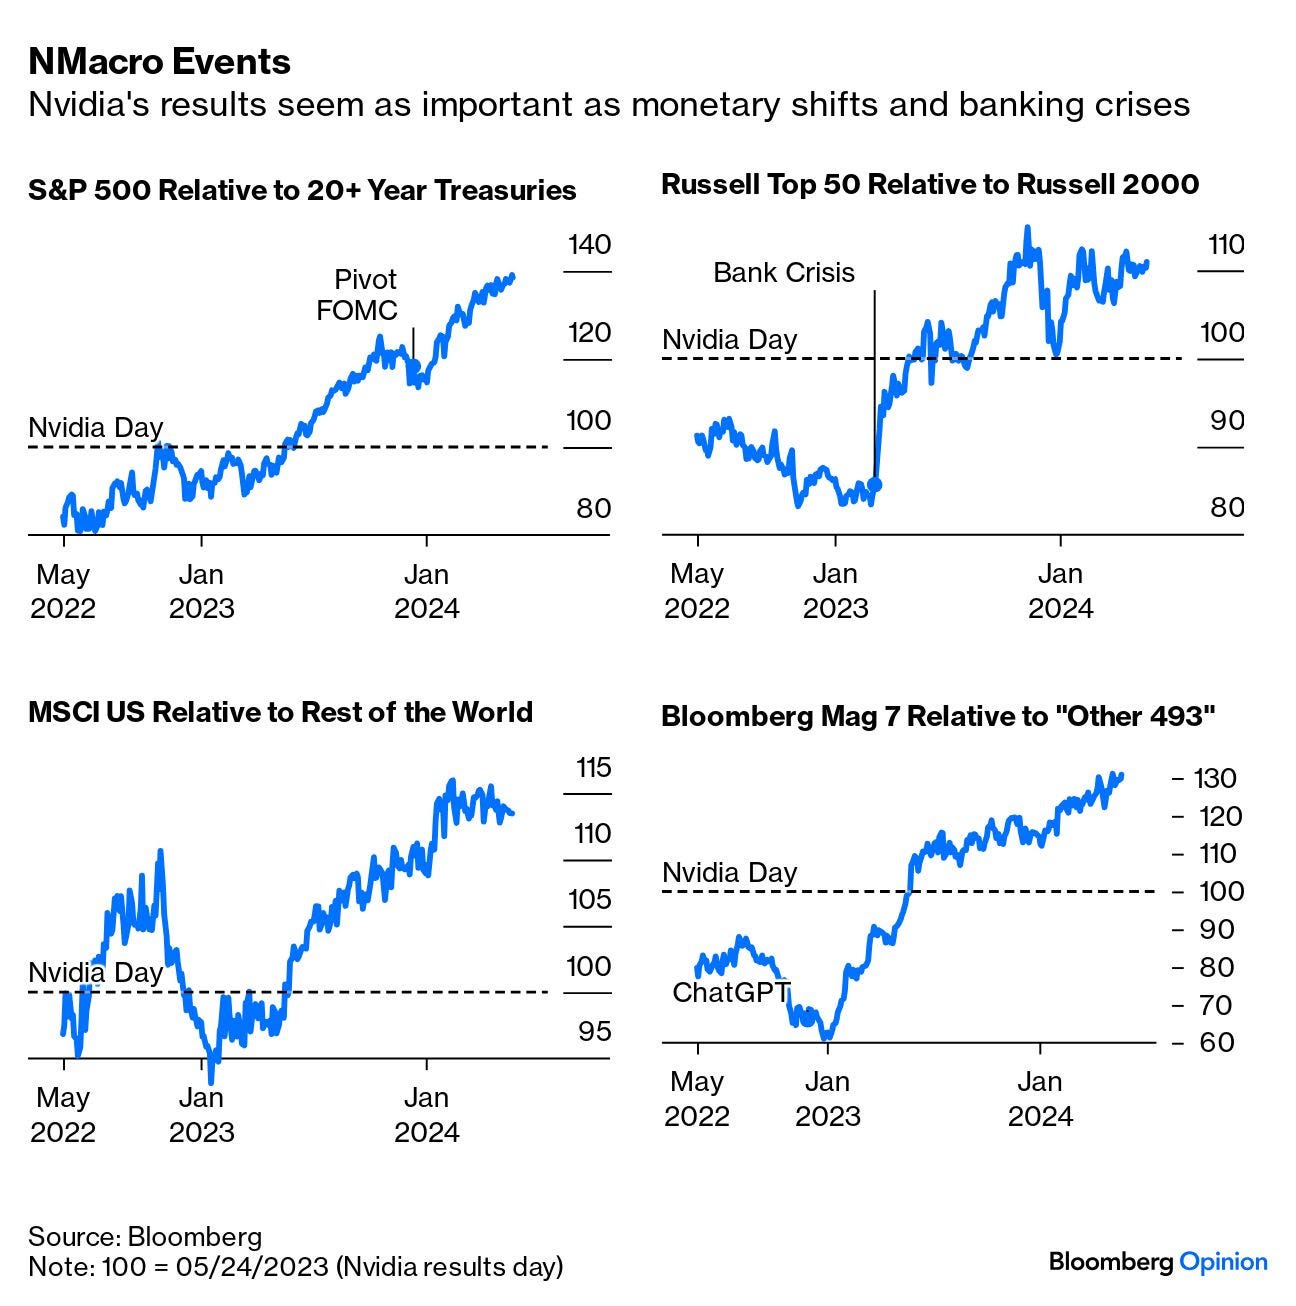
Bloomberg put together a nice dashboard of graphs across multiple markets and measures showing NVDA day (spring ‘23) as the launch point.
The Regional banking crisis of March last year, and the extra central bank liquidity it brought, seems to have had more to do with mega-caps’ beating small-caps than the Nvidia results a few weeks later, and the big upturn in the Magnificent 7 stocks got going shortly after the launch of ChatGPT.
Look, I mean, you examine these inputs and you cannot overstate the importance of NVDA, ChatGPT, AI, Liquidity etc…but yesterday I had the quote from Carroll and Alice in Wonderland, talking about the looking-glass and now here we are with sharp data that shows a single company’s earnings reports have the impact of major Macro events like Fed Meetings, Monetary Policy decisions and Inflation reports.
It all seems a bit too much.
DAILY NOTES
Harris came out with a new poll, I will preface this by writing that I could not find how many respondents, nor their political affiliation or income level in the survey. That being said, the results are shocking:
55% believe the economy is shrinking.
49% believe the SP500 is Lower on the year.
49% believe that Unemployment is at a 50 year High.
TGT down sharply - about -7% post EPS miss.
3 of the top 5 performers in the SP 500 YTD are now Utility Companies…should bode well for the long XLU/short SPY Ratio trade.
Lightest volume day in SPY yesterday in over 7 years.
Ramaswamy takes a position in Buzzfeed and creates a bid of 58% in the stock.
Interesting update from GS and its High Touch Desk
PERFORMANCE: US equity long/short hedge funds have generated a solid +8% YTD return. The strong performance of popular hedge fund long positions has boosted hedge fund returns despite a recent short squeeze in popular shorted stocks.
LEVERAGE AND SHORT INTEREST: Hedge funds have modestly lifted net leverage alongside the broader market rally while maintaining record gross leverage. Concentrated short positions have been particularly volatile recently, causing funds to rotate out of their favorite longs to cover shorts. However, the most recent short squeeze fell shy of the recent experiences in 2021 and December 2023. Short interest for the median S&P 500 stock remains very low at 1.8% of float. Instead, funds continue to use macro products.
HEDGE FUND VIPS: Mega-caps remain the most popular hedge fund long positions. AMZN, MSFT, META, GOOGL, NVDA continue to rank as the top five stocks in the VIP list this quarter, with AAPL joining the top six. The VIP list contains the 50 stocks that appear most often among the top 10 holdings of fundamental hedge funds. The basket has outperformed the S&P 500 in 60% of quarters since 2001 with an average quarterly excess return of 47 bp. 14 new constituents: ALIT, APP, DELL, DFS, GDDY, JPM, MU, NEE, SE, SN, VST, WDC, WIX, X.
SECTORS: Hedge funds continued to rotate toward cyclicals, with broad-based increases across Consumer Discretionary, Financials, and Energy. DFS joined this quarter's VIP list, as did JPM, and also joined BK and SPGI to screen among this quarter's list of Rising Stars with the largest increase in hedge fund popularity. Soaring prices also lifted the weight of Semiconductor stocks in hedge fund long portfolios to a new record, at 6.5%. MRVL is the top Rising Star and MU entered our basket of favorite hedge fund long positions.
Copper squeeze may be ending..front month off about -3.5%
Silver off by -1%
Let’s see what Fireworks happen after the close and tomorrow.
Trade Em Well Today